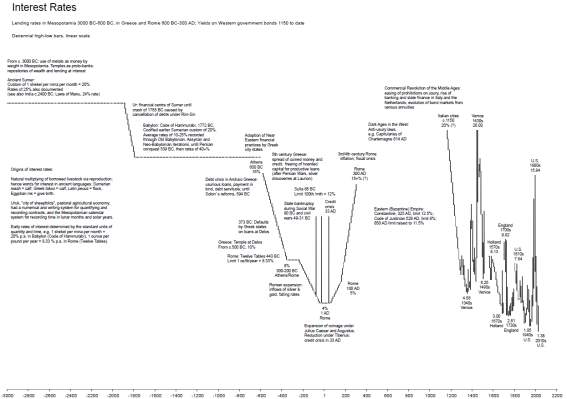
If you look at your financial mailers instead of simply throwing them away, you may already know that federal interest rates are at ‘their lowest levels in years.’ But how many years exactly? A chart by @Macro_Tourist published by investing site ZeoHedge purports to show the relative value of interest rates—since the dawn of human civilization.
Looking at 5000 years of interest rate and commodity history, the site concludes that the “trend is very clear [that] epochal events drive volatility.” The chart below, part of a group of timelines tracking gold prices, commodities, the U.S. dollar, shows interest rates since 3000 B.C. through the Roman Empire and to today. (All the charts are available in this PDF.)
Click below to enlarge chart.


